Year 10 (ages 14–15, Grade 9 in the US) · Maths · Statistics · Lesson 2
Averages from grouped data
Estimate the mean from grouped frequency tables using midpoints, find the modal class and the class containing the median (made-up data).
Exam boards: this lesson matches the AQA and Pearson Edexcel GCSE maths courses. Check which course your school follows.
11-minute video lesson
Teaching, worked examples and 20 practice questions solved step by step.
Watch free for a monthWhat your child will learn
- Read inequality class notation
- Estimate the mean using midpoints
- Find the modal class
- Find the class containing the median
The method
- Estimated mean: use midpoints.
- Total of (midpoint × f) ÷ total frequency.
- Modal class: highest frequency.
- Median class: running totals to (n + 1) ÷ 2.
Key words: grouped data, class, midpoint, estimate, modal class.
Worked examples
Worked examples from the lesson, with every step.
Question 1
Times: 0 < t ≤ 10: 3; 10 < t ≤ 20: 5; 20 < t ≤ 30: 8; 30 < t ≤ 40: 4. Estimate the mean.
- Step 1: 15 + 75 + 200 + 140 = 430
- Step 2: 430 ÷ 20
Answer: 21.5 minutes
Question 2
Using the same table, find the modal class.
- Step 1: 8
Answer: 20 < t ≤ 30
Question 3
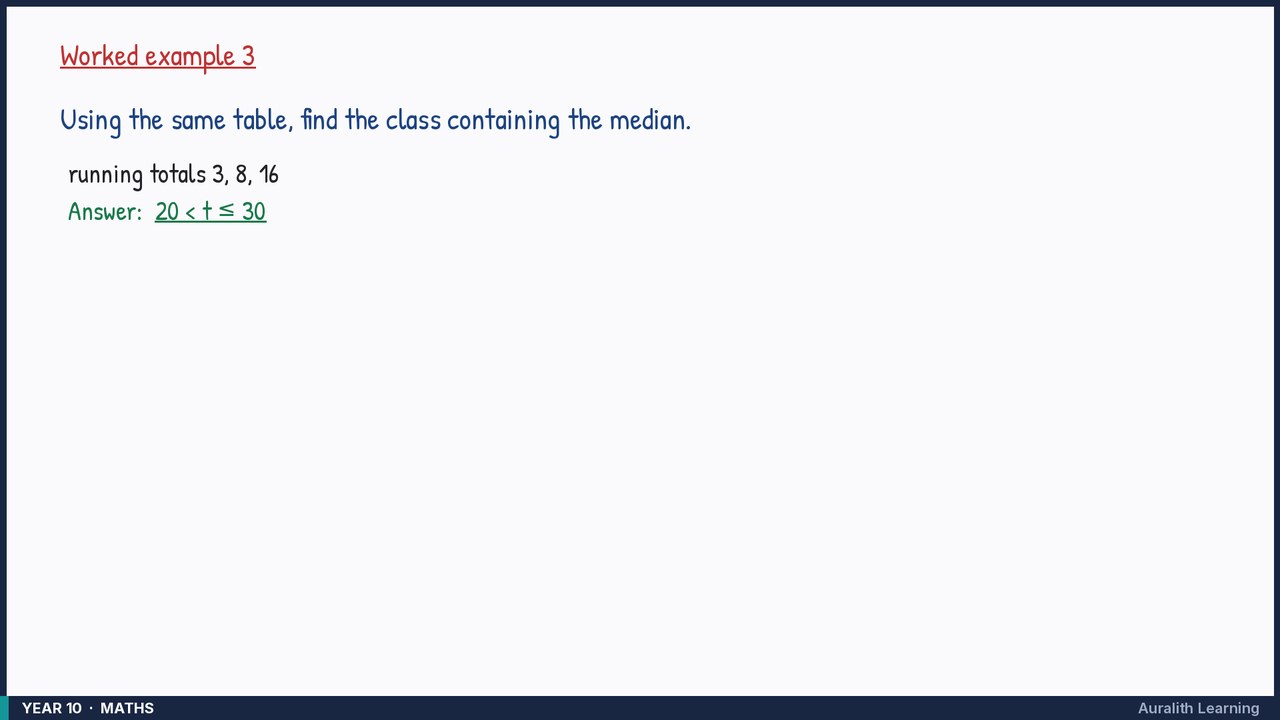
Using the same table, find the class containing the median.
- Step 1: running totals 3, 8, 16
Answer: 20 < t ≤ 30