Year 10 (ages 14–15, Grade 9 in the US) · Maths · Statistics · Lesson 4
Frequency polygons and comparing distributions
Draw and read frequency polygons, and compare two distributions using an average and the range, in context (made-up data).
Exam boards: this lesson matches the AQA and Pearson Edexcel GCSE maths courses. Check which course your school follows.
23-minute video lesson
Teaching, worked examples and 20 practice questions solved step by step.
Watch free for a monthWhat your child will learn
- Read frequency polygons
- Plot at midpoints
- Compare an average
- Compare spread in context
The method
- Plot at midpoints, join with straight lines.
- Compare an average.
- Compare the spread (range).
- Write both in context.
Key words: frequency polygon, midpoint, distribution, spread, consistent.
Worked examples
Worked examples from the lesson, with every step.
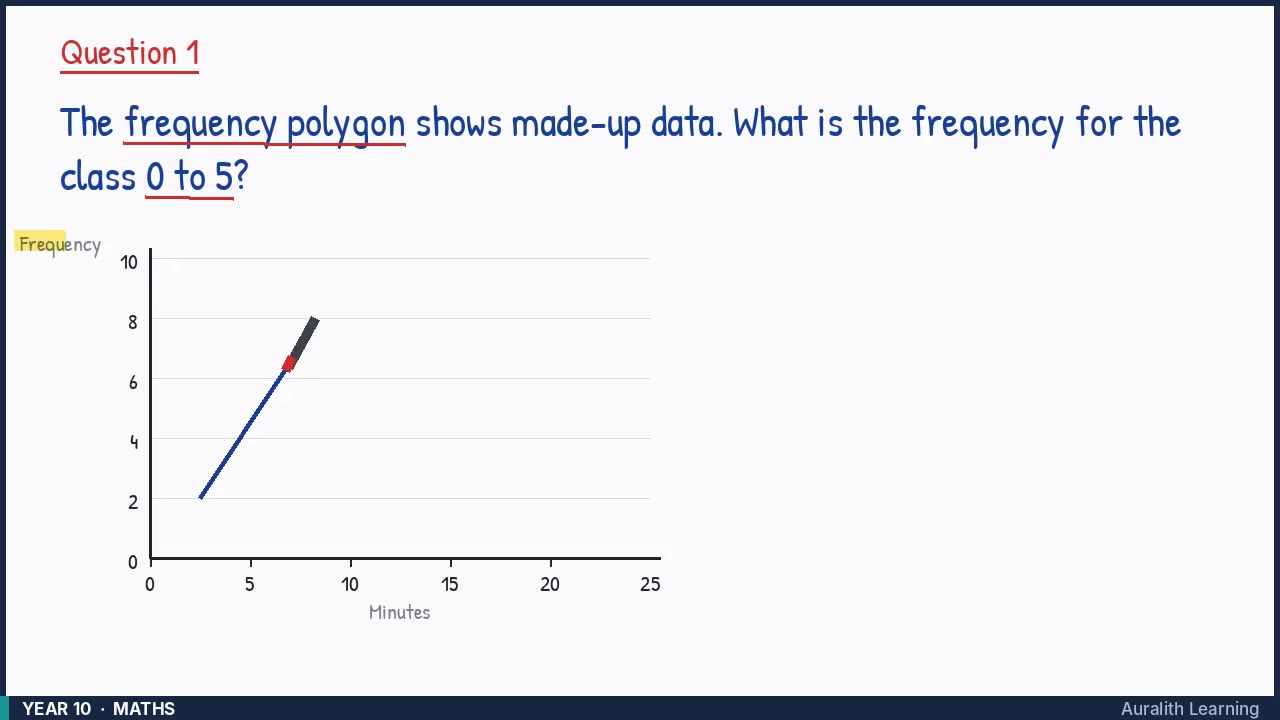
Question 1
The frequency polygon shows made-up data. What is the frequency for the class 0 to 5?
- Step 1: Look at the graph
- Step 2: Points are plotted at class midpoints
- Step 3: Midpoint = (0 + 5) ÷ 2 = 2.5
- Step 4: Read up from 2.5: frequency 2
Answer: 2
Question 2
The frequency polygon shows made-up data. What is the frequency for the class 10 to 15?
- Step 1: Look at the graph
- Step 2: Points are plotted at class midpoints
- Step 3: Midpoint = (10 + 15) ÷ 2 = 12.5
- Step 4: Read up from 12.5: frequency 9
Answer: 9
Question 3
The frequency polygon shows made-up data. What is the frequency for the class 15 to 20?
- Step 1: Look at the graph
- Step 2: Points are plotted at class midpoints
- Step 3: Midpoint = (15 + 20) ÷ 2 = 17.5
- Step 4: Read up from 17.5: frequency 5
Answer: 5