Year 10 (ages 14–15, Grade 9 in the US) · Maths · Statistics · Lesson 1
Averages from frequency tables
Find the mean, median, mode and range from lists and frequency tables (made-up data), choose suitable averages, and compare distributions.
Exam boards: this lesson matches the AQA and Pearson Edexcel GCSE maths courses. Check which course your school follows.
9-minute video lesson
Teaching, worked examples and 20 practice questions solved step by step.
Watch free for a monthWhat your child will learn
- Find averages from frequency tables
- Find the median position
- Choose a suitable average
- Compare data sets
The method
- Mean: multiply value × frequency, add, ÷ total frequency.
- Median: position (n + 1) ÷ 2, count down the frequencies.
- Mode: value with the highest frequency.
- Range: largest − smallest value.
Key words: mean, median, mode, range, frequency table.
Worked examples
Worked examples from the lesson, with every step.
Question 1
Pets 0, 1, 2, 3, 4 have frequencies 2, 5, 9, 3, 1. Find the mean.
- Step 1: 0 + 5 + 18 + 9 + 4 = 36; frequency 20
- Step 2: 36 ÷ 20
Answer: 1.8
Question 2
Using the same table, find the median.
- Step 1: 10.5th
- Step 2: 2, 7, 16 → both in the ‘2’ row
Answer: 2
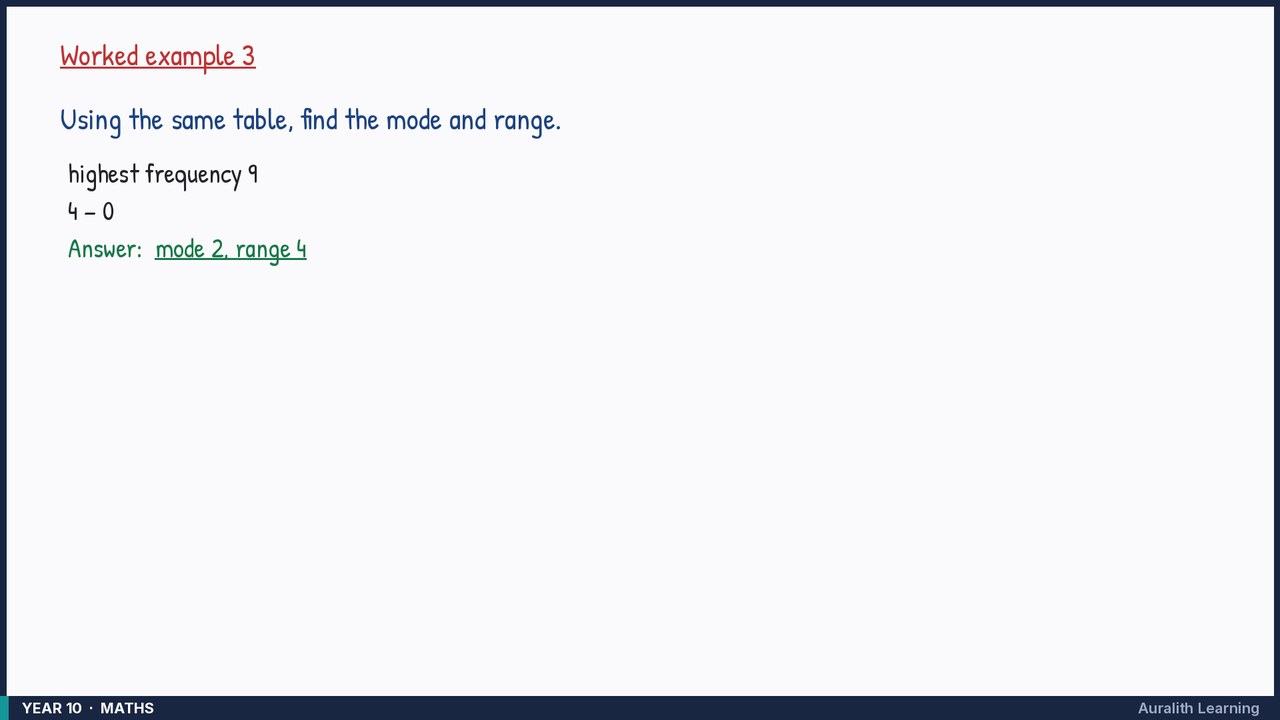
Question 3
Using the same table, find the mode and range.
- Step 1: highest frequency 9
- Step 2: 4 − 0
Answer: mode 2, range 4