Year 9 (ages 13–14, Grade 8 in the US) · Science · Pressure and motion · Lesson 3
Speed and distance-time graphs
Calculating speed, distance and time, average speed, relative motion and reading distance-time graphs including gradient as speed.
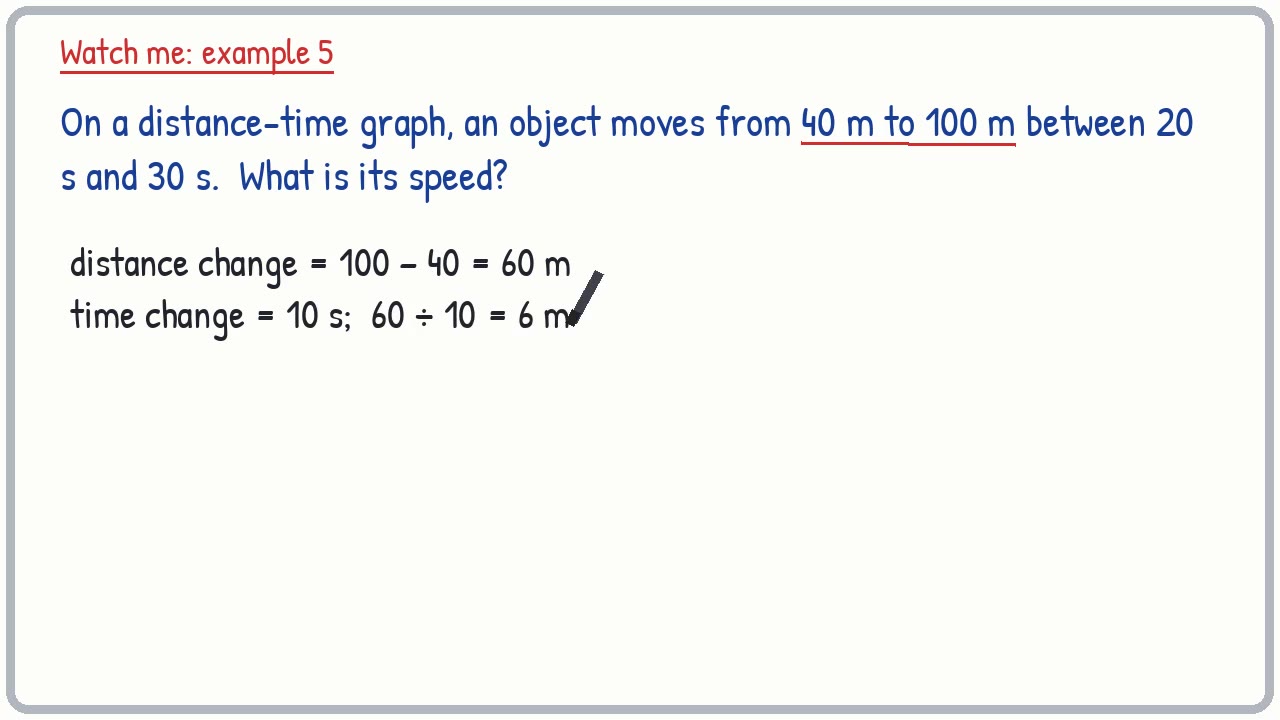
18-minute video lesson
Teaching, worked examples and 20 practice questions solved step by step.
Watch free for a monthWhat your child will learn
- Calculate speed
- Rearrange the speed formula
- Read distance-time graphs
- Find speed from a gradient
The method
- Write the formula: speed = distance ÷ time.
- Convert units first.
- Graphs: speed = gradient.
- Flat = stopped; steeper = faster.
Key words: speed, distance, time, gradient, distance-time graph, stationary.
Worked examples
Worked examples from the lesson, with every step.
Question 1
A cyclist travels 200 m in 40 s. What is the speed?
- Step 1: speed = distance ÷ time
- Step 2: 200 ÷ 40 = 5 m/s
Answer: 5 m/s
Question 2
A cyclist travels 50 m in 10 s. What is the speed?
- Step 1: speed = distance ÷ time
- Step 2: 50 ÷ 10 = 5 m/s
Answer: 5 m/s
Question 3
A train travels 1500 m in 300 s. What is the speed?
- Step 1: speed = distance ÷ time
- Step 2: 1500 ÷ 300 = 5 m/s
Answer: 5 m/s