Year 8 (ages 12–13, Grade 7 in the US) · Maths · Averages · Lesson 3
Comparing two sets of data
Compare two sets of data using an average (mean or median) and the range, write comparisons in context, and choose a suitable average when there are outliers.
26-minute video lesson
Teaching, worked examples and 20 practice questions solved step by step.
Watch free for a monthWhat your child will learn
- Calculate averages and ranges for two data sets
- Compare data using an average and the range
- Write comparisons in context
- Choose the mean or median sensibly
The method
- Work out an average for each set.
- Work out the range for each set.
- Compare: 'On average ... is higher.'.
- Smaller range: 'more consistent'.
Key words: mean, median, range, consistent, outlier, compare.
Worked examples
Worked examples from the lesson, with every step.
Question 1
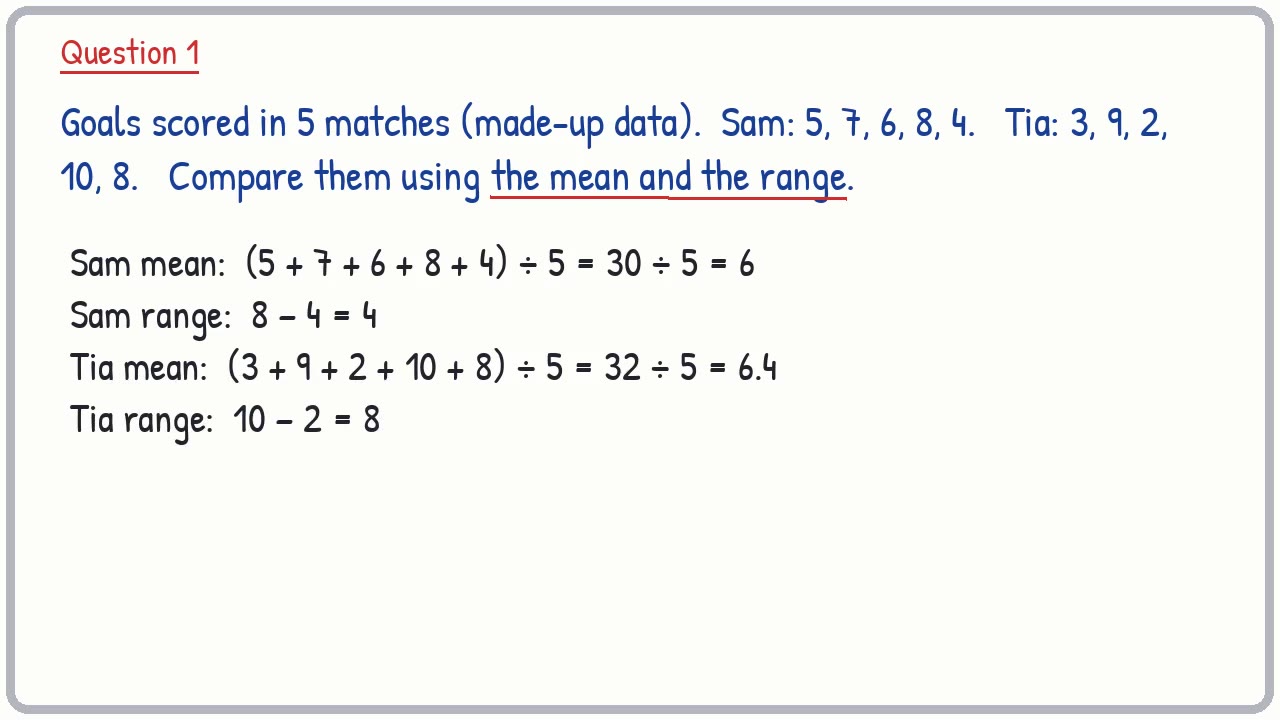
Goals scored in 5 matches (made-up data). Sam: 5, 7, 6, 8, 4. Tia: 3, 9, 2, 10, 8. Compare them using the mean and the range.
- Step 1: Sam mean: (5 + 7 + 6 + 8 + 4) ÷ 5 = 30 ÷ 5 = 6
- Step 2: Sam range: 8 − 4 = 4
- Step 3: Tia mean: (3 + 9 + 2 + 10 + 8) ÷ 5 = 32 ÷ 5 = 6.4
- Step 4: Tia range: 10 − 2 = 8
- Step 5: Average: Tia is higher (6.4 > 6)
- Step 6: Range: Sam is more consistent (4 < 8)
Answer: On average Tia scored more (mean 6.4 v 6); Sam is more consistent (range 4 v 8)
Question 2
Daily sales of a sandwich (made-up data). Shop P: 20, 24, 22, 26, 23. Shop Q: 15, 30, 28, 18, 34. Compare them using the mean and the range.
- Step 1: Shop P mean: (20 + 24 + 22 + 26 + 23) ÷ 5 = 115 ÷ 5 = 23
- Step 2: Shop P range: 26 − 20 = 6
- Step 3: Shop Q mean: (15 + 30 + 28 + 18 + 34) ÷ 5 = 125 ÷ 5 = 25
- Step 4: Shop Q range: 34 − 15 = 19
- Step 5: Average: Shop Q is higher (25 > 23)
- Step 6: Range: Shop P is more consistent (6 < 19)
Answer: On average Shop Q sold more (mean 25 v 23); Shop P is more consistent (range 6 v 19)
Question 3
Times (seconds) to run 300 m (made-up data). Ali: 42, 45, 44, 47, 46. Bo: 38, 50, 41, 52, 39. Compare them using the median and the range.
- Step 1: Ali in order: 42, 44, 45, 46, 47; median 45
- Step 2: Ali range: 47 − 42 = 5
- Step 3: Bo in order: 38, 39, 41, 50, 52; median 41
- Step 4: Bo range: 52 − 38 = 14
- Step 5: Average: Ali is slower (45 > 41)
- Step 6: Range: Ali is more consistent (5 < 14)
Answer: On average Ali was slower (median 45 s v 41 s); Ali is more consistent (range 5 s v 14 s)