Year 3 (ages 7–8, Grade 2 in the US) · Maths · Statistics · Lesson 1
Pictograms and tables
Reading pictograms with keys of 2, 4 and 5 (including half symbols), tally charts and tables, and answering comparison and total questions (made-up data).
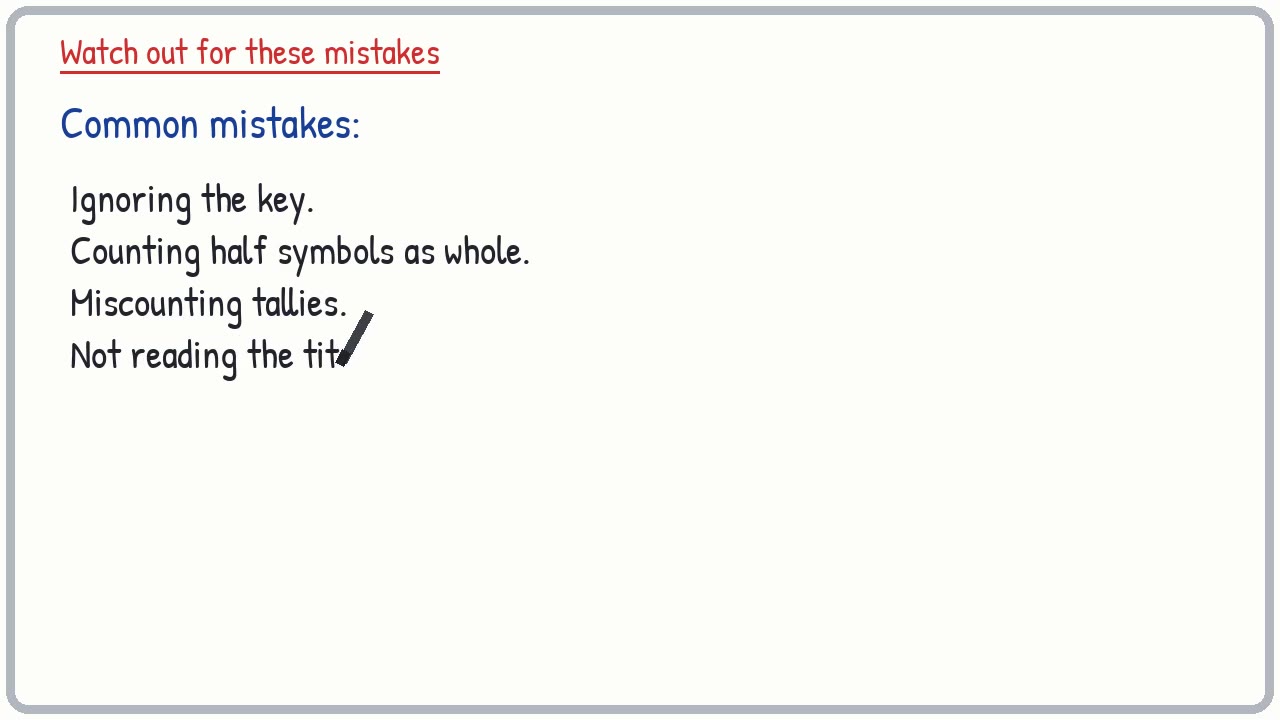
18-minute video lesson
Teaching, worked examples and 20 practice questions solved step by step.
Watch free for a monthWhat your child will learn
- Read pictograms using a key
- Read tables and tallies
- Find totals and differences
- Find most and least popular
The method
- Title.
- Key.
- Read.
- Compare.
Key words: pictogram, key, tally, table, data, survey.
Worked examples
The worked examples in this lesson use pictures, so watch them in the video.