Year 11 (ages 15–16, Grade 10 in the US) · Maths · Higher statistics · Lesson 1
Cumulative frequency and box plots
Building cumulative frequency tables, estimating the median and quartiles, finding the interquartile range, drawing and reading box plots, and comparing two distributions using the median and interquartile range.
Exam boards: this lesson matches the AQA and Pearson Edexcel GCSE maths courses. Check which course your school follows.
10-minute video lesson
Teaching, worked examples and 20 practice questions solved step by step.
Watch free for a monthWhat your child will learn
- Complete a cumulative frequency table
- Estimate the median and quartiles
- Draw and interpret box plots
- Compare distributions using median and IQR
The method
- Cumulative frequency: keep a running total.
- Plot at the upper end of each class and join with a smooth curve.
- Median at n/2; quartiles at n/4 and 3n/4.
- Compare: median (average) and IQR (spread).
Key words: cumulative frequency, median, quartile, interquartile range, box plot.
Worked examples
Worked examples from the lesson, with every step.
Question 1
Frequencies for 0–10, 10–20, 20–30, 30–40 are 5, 12, 18, 5. Write the cumulative frequencies.
- Step 1: 5, 5 + 12 = 17, 17 + 18 = 35, 35 + 5 = 40
Answer: 5, 17, 35, 40
Question 2
In that data, which class contains the median?
- Step 1: n/2 = 40 ÷ 2 = 20th value
- Step 2: 17 < 20 ≤ 35
Answer: the 20–30 class
Question 3
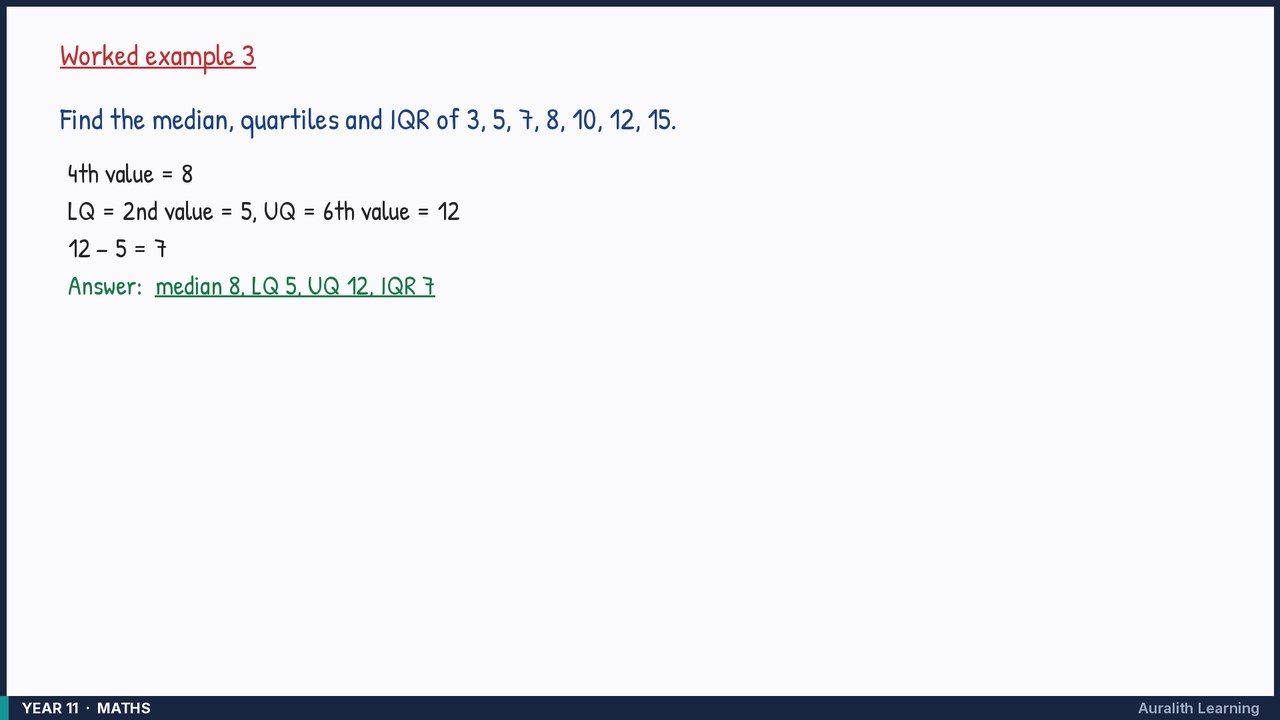
Find the median, quartiles and IQR of 3, 5, 7, 8, 10, 12, 15.
- Step 1: 4th value = 8
- Step 2: LQ = 2nd value = 5, UQ = 6th value = 12
- Step 3: 12 − 5 = 7
Answer: median 8, LQ 5, UQ 12, IQR 7