Year 10 (ages 14–15, Grade 9 in the US) · Maths · Probability · Lesson 1
Venn diagrams and probability
Complete frequency Venn diagrams and find probabilities of 'and', 'or', 'only', 'neither' and 'not' events (made-up data).
Exam boards: this lesson matches the AQA and Pearson Edexcel GCSE maths courses. Check which course your school follows.
8-minute video lesson
Teaching, worked examples and 20 practice questions solved step by step.
Watch free for a monthWhat your child will learn
- Complete a Venn diagram from information
- Find probabilities from Venn diagrams
- Use P(not A) = 1 − P(A)
- Recognise mutually exclusive events
The method
- Fill the overlap (both) first.
- Then 'only' parts, then neither.
- P = number in region ÷ total.
- 'or' includes the overlap.
Key words: Venn diagram, universal set, intersection, union, mutually exclusive.
Worked examples
Worked examples from the lesson, with every step.
Question 1
30 people: 18 like tea, 15 like coffee, 7 like both. How many like tea only?
- Step 1: 18 − 7
Answer: 11
Question 2
Using the same survey, how many like neither?
- Step 1: 11 + 7 + 8 = 26
- Step 2: 30 − 26
Answer: 4
Question 3
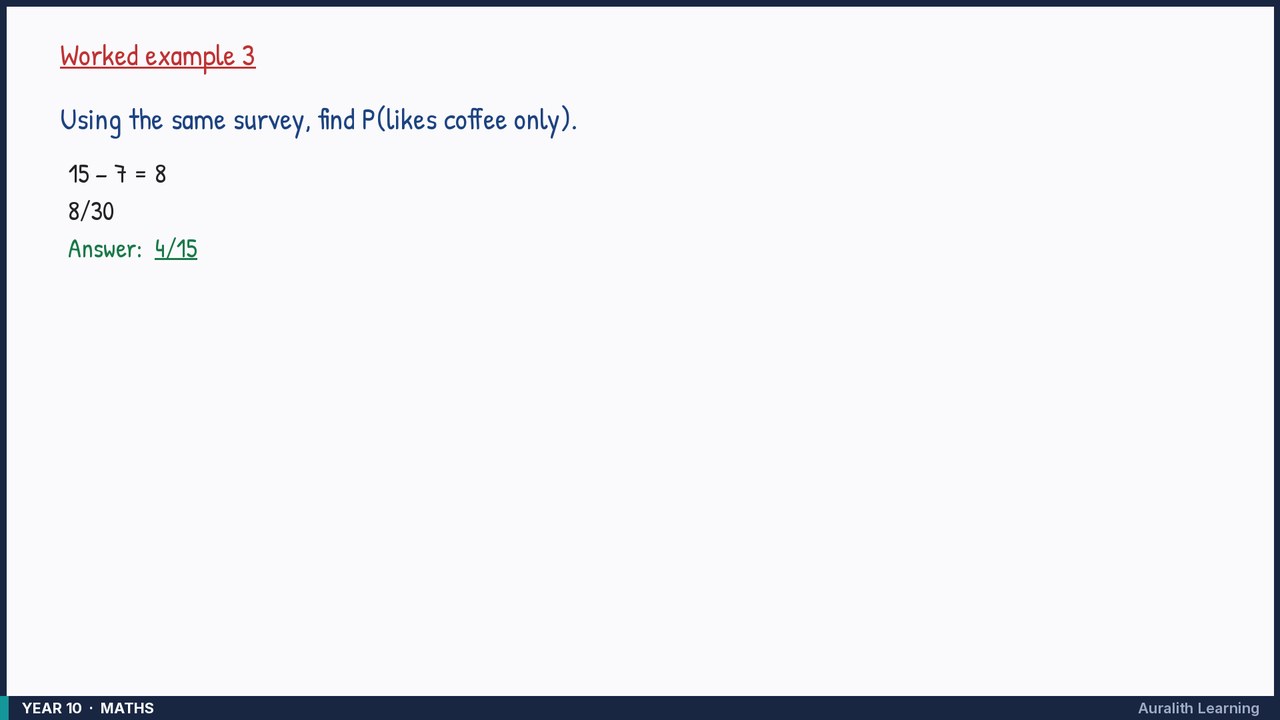
Using the same survey, find P(likes coffee only).
- Step 1: 15 − 7 = 8
- Step 2: 8/30
Answer: 4/15